
diff options
| author | krakenrf <78108016+krakenrf@users.noreply.github.com> | 2024-07-19 11:19:00 +0200 |
|---|---|---|
| committer | krakenrf <78108016+krakenrf@users.noreply.github.com> | 2024-07-19 11:19:00 +0200 |
| commit | 1636d7292b7a4e1b964906e8155e9d80ba5e0df8 (patch) | |
| tree | 24ca46493ae61a8a820187d0bf0dd79c7b6bd34d | |
| parent | Updated 11. Kraken Pro Cloud Mapper (markdown) (diff) | |
| download | krakensdr_docs.wiki-1636d7292b7a4e1b964906e8155e9d80ba5e0df8.tar krakensdr_docs.wiki-1636d7292b7a4e1b964906e8155e9d80ba5e0df8.tar.gz krakensdr_docs.wiki-1636d7292b7a4e1b964906e8155e9d80ba5e0df8.tar.bz2 krakensdr_docs.wiki-1636d7292b7a4e1b964906e8155e9d80ba5e0df8.tar.lz krakensdr_docs.wiki-1636d7292b7a4e1b964906e8155e9d80ba5e0df8.tar.xz krakensdr_docs.wiki-1636d7292b7a4e1b964906e8155e9d80ba5e0df8.tar.zst krakensdr_docs.wiki-1636d7292b7a4e1b964906e8155e9d80ba5e0df8.zip | |
| -rw-r--r-- | 11.-Kraken-Pro-Cloud-Mapper.md | 76 |
1 files changed, 38 insertions, 38 deletions
diff --git a/11.-Kraken-Pro-Cloud-Mapper.md b/11.-Kraken-Pro-Cloud-Mapper.md index dbef149..9170300 100644 --- a/11.-Kraken-Pro-Cloud-Mapper.md +++ b/11.-Kraken-Pro-Cloud-Mapper.md @@ -92,41 +92,6 @@ To control several KrakenSDR's in a group, click the gear icon next to the group ### KrakenSDR Multi-VFO KrakenSDR is capable of outputting DoA data for multiple VFOs. If your KrakenSDR is set to output multiple VFOs, you can select which VFO gets displayed on the map by using the 'VFO Frequency' drop-down box. For each VFO frequency, there should be one entry in the drop-down box that can be selected. -## Options and Features - -### Main configure button (blue gear icon at the top) - -**Heatmap Size:** Total size from edge to edge in kilometers of the heatmap grid. Set this appropriately for your expected search space. Too large and you will lose resolution. Too small and you may have difficulting visualizing the lobe intersections. - -**Heatmap Resolution:** Number of cells per axis on the grid. A higher value can result in more precise TX localization. But setting it too high can make calculations too slow. Maximum resolution is currently capped at 250. - -It's important to note that setting a smaller heatmap size naturally results in a higher resolution grid. For example, if you set your grid to 100km and resolution to 500, each grid cell has a size of 100,000/500 = 200 x 200 meters. - -Now if you set the grid size to 10km, each cell has a size of 20 x 20 meters. - -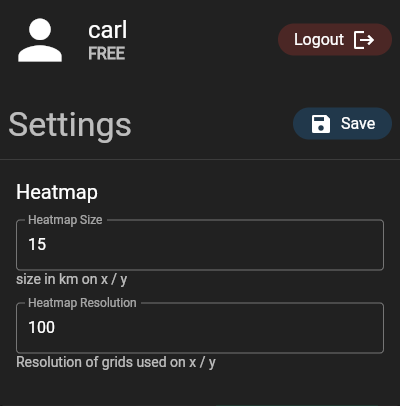 - -### Double Click Menu - -If you double-click on the map a menu will pop up. - - - -**Add Marker:** Adds a reference marker on the map. Useful for marking to location of known transmitters. - -**Center Heatmap:** Centers the heatmap grid wherever you clicked. - -**Set as Home:** Tells the mapper where on the map the mapper should default to upon load. - -**Copy Lat, Lon:** Copies to the clipboard the current latitude and longitude of the point you double clicked at. - -**Open in Google Maps:** Open the coordinates where you double clicked in Google Maps. This may be useful if you want to use street view. - -### Layer Options -Layer options can be accessed via the layers button  on the top right. - -This allows you to choose between a light or dark street map, or a satellite image map. - ## History The cloud mapper is capable of playing back data received over 24 hours. As long as your KrakenSDR is online, and has the KrakenSDR showing green in the cloud mapper, data is constantly being recorded. Currently, data is recorded for a week, anything older than a week is deleted. @@ -159,14 +124,49 @@ If the file contains multi-VFOs, select the VFO you are interested in. After a few moments, you should see the logfile load in. The heatmap calculation may take a few moments longer if the log file is large. -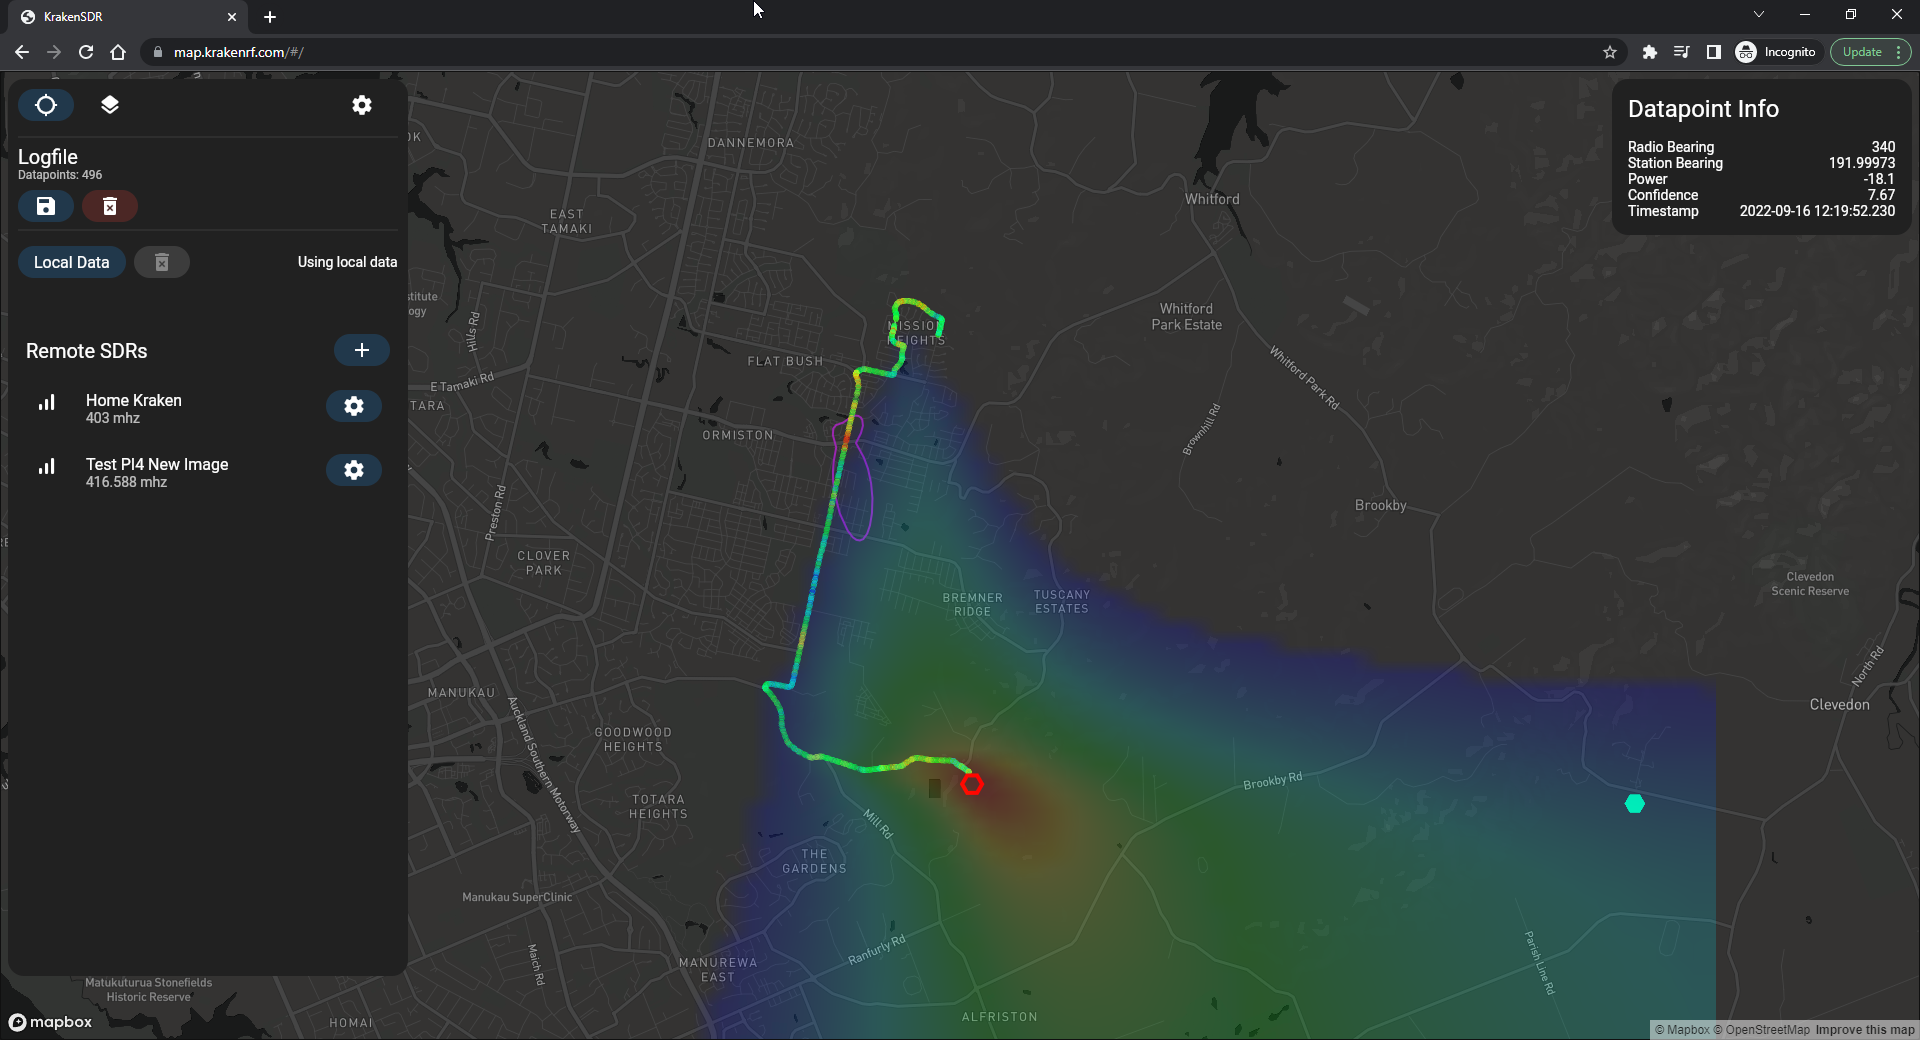 + You can click on individual data points on the map for more information about that particular point, as well as a drawing of the lobe. -## Moving Markers with Data +## Other Options and Features + +### Main configure button (blue gear icon at the top) + +**Heatmap Size:** Total size from edge to edge in kilometers of the heatmap grid. Set this appropriately for your expected search space. Too large and you will lose resolution. Too small and you may have difficulting visualizing the lobe intersections. + +**Heatmap Resolution:** Number of cells per axis on the grid. A higher value can result in more precise TX localization. But setting it too high can make calculations too slow. Maximum resolution is currently capped at 250. + +It's important to note that setting a smaller heatmap size naturally results in a higher resolution grid. For example, if you set your grid to 100km and resolution to 500, each grid cell has a size of 100,000/500 = 200 x 200 meters. + +Now if you set the grid size to 10km, each cell has a size of 20 x 20 meters. + + + +### Double Click Menu + +If you double-click on the map a menu will pop up. + + + +**Add Marker:** Adds a reference marker on the map. Useful for marking to location of known transmitters. + +**Center Heatmap:** Centers the heatmap grid wherever you clicked. + +**Set as Home:** Tells the mapper where on the map the mapper should default to upon load. + +**Copy Lat, Lon:** Copies to the clipboard the current latitude and longitude of the point you double clicked at. + +**Open in Google Maps:** Open the coordinates where you double clicked in Google Maps. This may be useful if you want to use street view. + +### Layer Options +Layer options can be accessed via the layers button  on the top right. + +This allows you to choose between a light or dark street map, or a satellite image map. + +## Externally Controlled Markers You can upload coordinate data to the KrakenSDR server and have it plotted as a marker on the map. This is useful for verifying a KrakenSDR setup, for example by driving around your target area with a beacon and GPS, or using a weather balloon radiosonde. -A Python script that shows an example of how to upload data to the server can be found at https://github.com/krakenrf/krakensdr_docs/blob/main/misc_scripts/sondehub_krakenmap.py. The script uses the SondeHub API to receive GPS coordinates of a weather balloon. The GPS coordinates are then forwarded to the Kraken Pro Cloud server. +A Python script that shows an example of how to upload data to the server can be found at https://github.com/krakenrf/krakensdr_docs/blob/main/misc_scripts/sondehub_krakenmap.py. The script uses the SondeHub API to receive GPS coordinates of a weather balloon. The GPS coordinates are then forwarded to the Kraken Pro Cloud server. # Future Features Our developer is currently working on new advanced features, some of which may require a subscription payment. These features include |