diff options
| -rw-r--r-- | 08.-Passive-Radar.md | 10 |
1 files changed, 8 insertions, 2 deletions
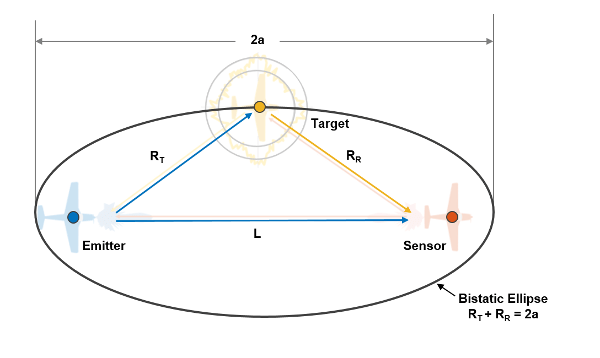
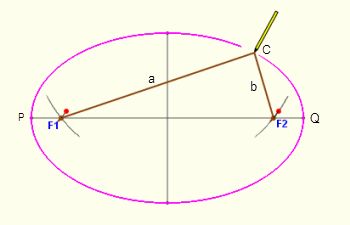
diff --git a/08.-Passive-Radar.md b/08.-Passive-Radar.md index 6bc07eb..ba240b1 100644 --- a/08.-Passive-Radar.md +++ b/08.-Passive-Radar.md @@ -121,11 +121,17 @@ In the future we aim to have software enhancements that make understanding and v The bistatic range displayed on the KrakenSDR range-doppler graph is described by the formula $\mathrm{Bistatic Range (meters)} = R_b = R_{tx} + R_{rx} - L$. So you can see that a single reading on the range-doppler graph describes an ellipse of possible locations. -For drawing an ellipse we can then use the equation $2a = R_b + L = R_{tx} + R_{rx}$ +For drawing an ellipse we can then use the equation $R_b + L = R_{tx} + R_{rx} = 2a$  -(Image credit: https://www.mathworks.com/help/fusion/ug/track-using-bistatic-range-detections.html) +(Image Credit: https://www.mathworks.com/help/fusion/ug/track-using-bistatic-range-detections.html) + +You can visualize the value of $R_b + L = R_{tx} + R_{rx} = 2a$ by drawing an ellipse with two pins spaced out at distance $L$, and a piece of string of length $R_b + L$. The ellipse plotted is your contact bistatic range ellipse. The target's position could be anywhere on this ellipse. You can narrow down the possible actual using predefined knowledge of the direction that your surveillance antenna faces, and known knowledge of possible target locations. + + + +(Image Credit: https://www.mathopenref.com/constellipse1.html) # Range Resolution Range resolution depends on the sampling bandwidth, which for the KrakenSDR and RTL-SDR tuners inside is 2.4 MHz. Therefore we achieve $\frac{c}{fs} = \frac{299792458}{2400000} = ~125m$ resolution per range cell on the graph (assuming the illuminating signal is at least 2.4 MHz as well). |
